Devops Tutorial
개요
이전 실습EKS, Kubernetes를 마쳤다면 이번엔 ArgoCD, Prometheus, Granfanaf를 연동해 서비스 배포, 모니터링 파이프라인을 구축해보자
ArgoCD 연동
ArgoCD CLI 설치
https://argoproj.github.io/argo-cd/cli_installation/
kubectl create namespace argocd
kubectl apply -n argocd -f https://raw.githubusercontent.com/argoproj/argo-cd/stable/manifests/install.yaml
This will create a new namespace, argocd, where Argo CD services and application resources will live.
ArgoCD 설치
https://argoproj.github.io/argo-cd/getting_started/
ArgoCD Server 접속
URL을 통해 ArgoCD에 접근하기 위해서는 ArgoCD API server를 외부에 노출시켜야하므로 argocd-server의 service type 을 LoadBalancer 로 바꿔야 한다.
LB Endpoint를 노출 하더라도 도메인 등록 시간이 소요 되므로 브라우저를 통한 접근이 가능하기 까지는 약 5분 소요.
linux CLI
kubectl patch svc argocd-server -n argocd -p '{"spec": {"type": "LoadBalancer"}}'
Window CLI (escape 문자 추가)
kubectl patch svc argocd-server -n argocd -p '{\"spec\": {\"type\": \"LoadBalancer\"}}'
오류 수정
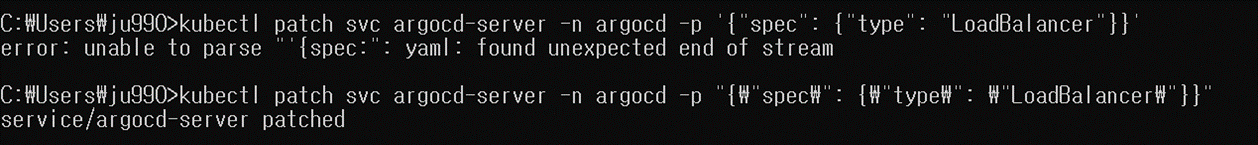
처음에 kubectl 사용 가이드를 그대로 따라 했지만 오류가 발생.
Window CLI, powershell 환경에서는 escape character을 추가해야 함.
Check the LB Endpoint
kubectl get -n argocd svc argocd-server
NAME            TYPE           CLUSTER-IP       EXTERNAL-IP                                                                    PORT(S)                      AGE
argocd-server   LoadBalancer   10.100.160.242   a1521dde2ec11asdg7fb04632sdda8-1608723687.ap-northeast-2.elb.amazonaws.com   80:32511/TCP,443:31088/TCP   21m
ArgoCD Login
EXTERNAL-IP를 통해 ArgoCD 접근
default Username : admin
Get Password
- linux CLI : https://argoproj.github.io/argo-cd/getting_started/#4-login-using-the-cli
kubectl -n argocd get secret argocd-initial-admin-secret -o jsonpath="{.data.password}" | base64 -d
Output을 바로 Password로 사용
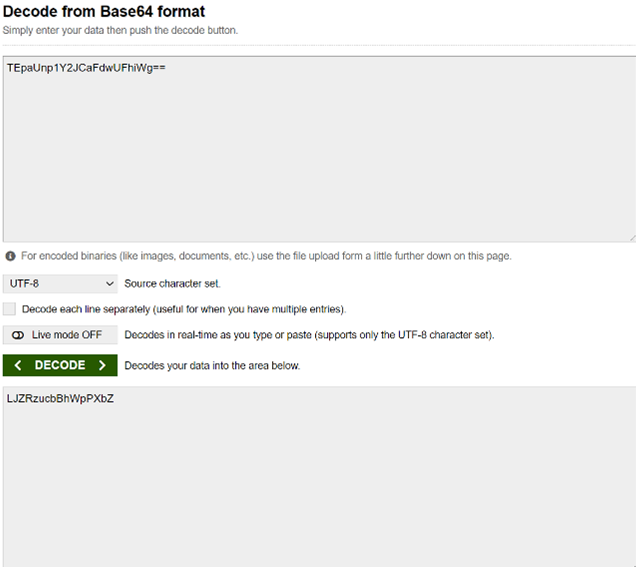
- Window CLI
위 리눅스 커맨드 경우 base64 인코딩값을 디코딩 후 Output으로 Password를 전달했지만 Window CLI에서는 작동하지 않는다.
best way는 아니지만 저자는 직접 base64 디코딩을 통해 암호를 확인했다.
kubectl -n argocd get secret argocd-initial-admin-secret -o jsonpath="{.data.password}"
Output은 아직 base64 디코딩 이전 상태
https://www.base64decode.org 접속 후 Output을 직접 decoding 후 Password로 사용
ArgoCD를 통해 모니터링 App(Prometheus, Grafana) 배포
Prometheus
웹 콘솔에 접속후 + New App 클릭하여 신규 애플리케이션(Prometheus) 생성
- GENERAL
- Application Name: prometheus
- Project: default
- Sync Policy: Manual
- SOURCE
- Repo URL: https://prometheus-community.github.io/helm-charts
HELM - Chart: prometheus
13.6.0 - DESTINATION
- Cluster URL: https://kubernetes.default.svc
- Namespace: default
Create
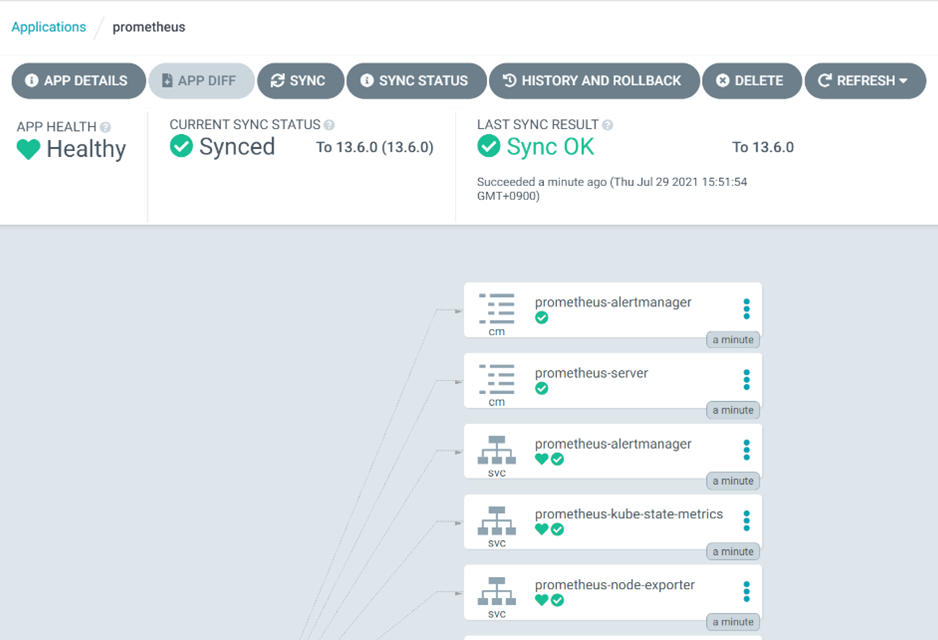
화면을 새로고침 하면 앱이 하나 등록 됨.
Sync 정책을 Manual 로 하였기 때문에 초기에 OutOfSync 상태는 정상.
SYNC
레포지토리 URL이 문제 없다면 sync가 완료 및 아래와 같이 확인 가능
Prometheus의 ClusterIP 확인 (Dashboard 구성에 필요)
kubectl get svc prometheus-server
NAME                TYPE        CLUSTER-IP       EXTERNAL-IP   PORT(S)   AGE
prometheus-server   ClusterIP   10.100.160.196   <none>        80/TCP    4m35s
Granfana
웹 콘솔에 접속후 + New App 클릭하여 신규 애플리케이션(Granfana) 생성
- GENERAL
- Application Name: Granfana
- Project: default
- Sync Policy: Manual
- SOURCE
- Repo URL: https://grafana.github.io/helm-charts
HELM - Chart: granfana
6.6.2 - DESTINATION
- Cluster URL: https://kubernetes.default.svc
- Namespace: default
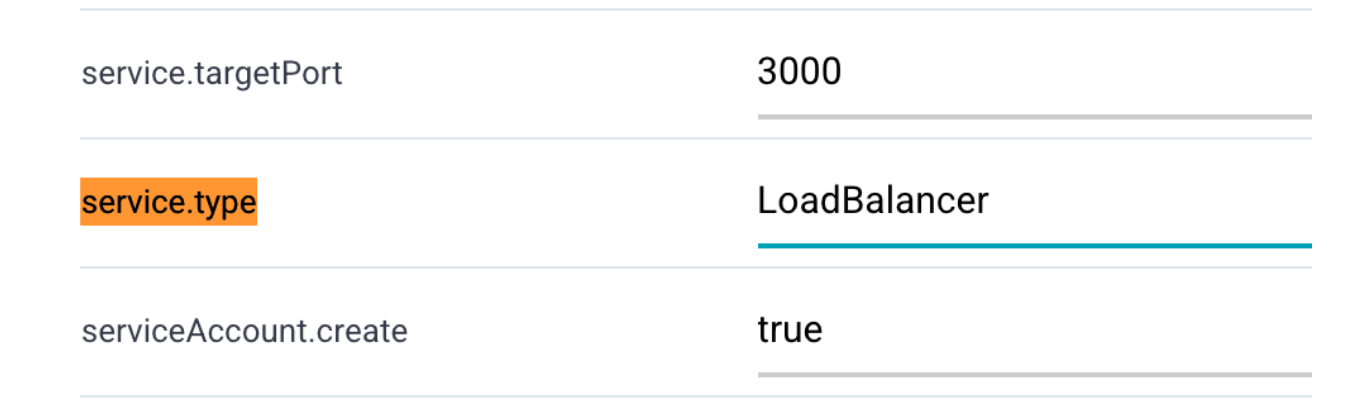
아래 HELM 변수값 탭에서 service.type 검색 후 값을 LoadBalancer 로 변경
Create 와 SYNC 수행 후 admin password 조회
kubectl get secret --namespace default grafana -o jsonpath="{.data.admin-password}" | base64 --decode ; echo
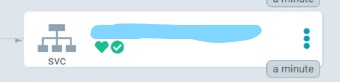
Endpoint 확인을 위해 ArgoCD 화면에서 Grafana 선택 후 상세페이지 Service(화면에서는 svc grafana)의 Hostnames 항목에 앱에 접속 가능한 LB URL이 생성 되었는지 확인
생성 되었다면 url을 통해 접속
Monitoring Dashboard 구성
- 왼쪽 텝 Configuration 에서 Data Sources 선택
- Prometheus Cluster IP를 HTTP URL로 지정
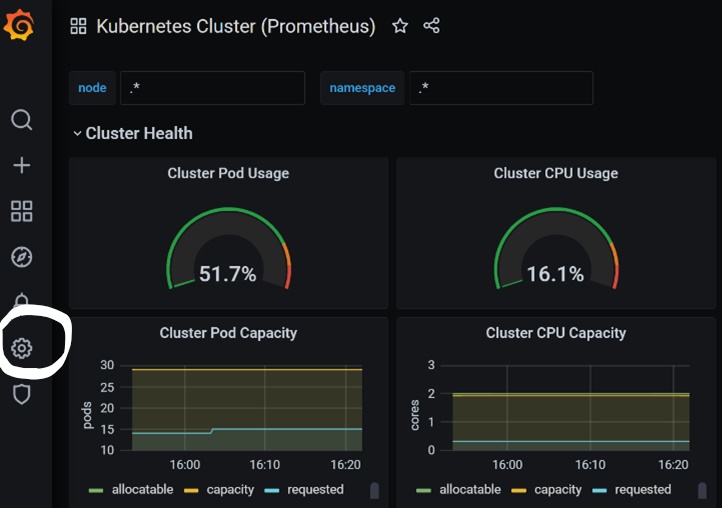
- SAVE & TEST 하여 Data Source 등록
- 왼쪽 텝에서 + 선택, Import -> Upload Json File: kubernetes-cluster-prometheus_rev1.json 업로드
- Options - prometheus:
Promethesus